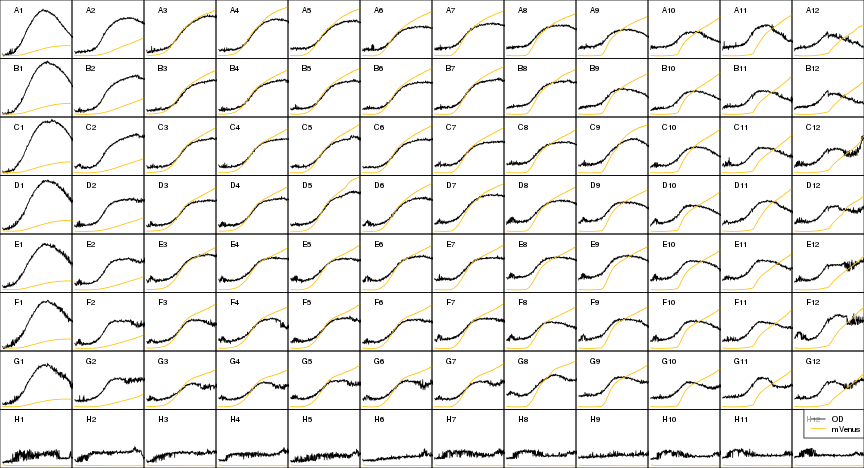
raw2 <- cutData(raw,rng=c(200,1500))
grodat <- data2grofit(raw2, did="OD", plate=plate,
                      wells=groups[["pUC18mV"]])
library(grofit)
fitparams <- grofit.2.control(interactive=FALSE, plot=TRUE) # SET ALL TO TRUE!!
pdf("growthrates.pdf")
fits <- gcFit.2(time=grodat$time, data=grodat$data, control=fitparams)
##
##
## = 1. growth curve =================================
## ----------------------------------------------------
## --> Try to fit model logistic
## ....... OK
## --> Try to fit model richards
## ....... ERROR in nls(). For further information see help(gcFitModel)
## --> Try to fit model gompertz
## ....... OK
## --> Try to fit model gompertz.exp
## ... ERROR in nls(). For further information see help(gcFitModel)
##
##
## = 2. growth curve =================================
## ----------------------------------------------------
## --> Try to fit model logistic
## ....... OK
## --> Try to fit model richards
## ....... OK
## --> Try to fit model gompertz
## ....... OK
## --> Try to fit model gompertz.exp
## ... ERROR in nls(). For further information see help(gcFitModel)
##
##
## = 3. growth curve =================================
## ----------------------------------------------------
## --> Try to fit model logistic
## ....... OK
## --> Try to fit model richards
## ....... OK
## --> Try to fit model gompertz
## ....... OK
## --> Try to fit model gompertz.exp
## ... ERROR in nls(). For further information see help(gcFitModel)
##
##
## = 4. growth curve =================================
## ----------------------------------------------------
## --> Try to fit model logistic
## ....... OK
## --> Try to fit model richards
## ....... ERROR in nls(). For further information see help(gcFitModel)
## --> Try to fit model gompertz
## ....... OK
## --> Try to fit model gompertz.exp
## ... ERROR in nls(). For further information see help(gcFitModel)
##
##
## = 5. growth curve =================================
## ----------------------------------------------------
## --> Try to fit model logistic
## ....... OK
## --> Try to fit model richards
## ....... ERROR in nls(). For further information see help(gcFitModel)
## --> Try to fit model gompertz
## ....... OK
## --> Try to fit model gompertz.exp
## ... ERROR in nls(). For further information see help(gcFitModel)
##
##
## = 6. growth curve =================================
## ----------------------------------------------------
## --> Try to fit model logistic
## ....... OK
## --> Try to fit model richards
## ....... ERROR in nls(). For further information see help(gcFitModel)
## --> Try to fit model gompertz
## ....... OK
## --> Try to fit model gompertz.exp
## ... ERROR in nls(). For further information see help(gcFitModel)
##
##
## = 7. growth curve =================================
## ----------------------------------------------------
## --> Try to fit model logistic
## ....... OK
## --> Try to fit model richards
## ....... ERROR in nls(). For further information see help(gcFitModel)
## --> Try to fit model gompertz
## ....... OK
## --> Try to fit model gompertz.exp
## ... ERROR in nls(). For further information see help(gcFitModel)
##
##
## = 8. growth curve =================================
## ----------------------------------------------------
## --> Try to fit model logistic
## ....... OK
## --> Try to fit model richards
## ....... OK
## --> Try to fit model gompertz
## ....... OK
## --> Try to fit model gompertz.exp
## ... ERROR in nls(). For further information see help(gcFitModel)
##
##
## = 9. growth curve =================================
## ----------------------------------------------------
## --> Try to fit model logistic
## ....... OK
## --> Try to fit model richards
## ....... ERROR in nls(). For further information see help(gcFitModel)
## --> Try to fit model gompertz
## ....... ERROR in nls(). For further information see help(gcFitModel)
## --> Try to fit model gompertz.exp
## ... ERROR in nls(). For further information see help(gcFitModel)
##
##
## = 10. growth curve =================================
## ----------------------------------------------------
## --> Try to fit model logistic
## ....... OK
## --> Try to fit model richards
## ....... ERROR in nls(). For further information see help(gcFitModel)
## --> Try to fit model gompertz
## ....... ERROR in nls(). For further information see help(gcFitModel)
## --> Try to fit model gompertz.exp
## ... ERROR in nls(). For further information see help(gcFitModel)
##
##
## = 11. growth curve =================================
## ----------------------------------------------------
## --> Try to fit model logistic
## ....... OK
## --> Try to fit model richards
## ....... ERROR in nls(). For further information see help(gcFitModel)
## --> Try to fit model gompertz
## ....... ERROR in nls(). For further information see help(gcFitModel)
## --> Try to fit model gompertz.exp
## ... ERROR in nls(). For further information see help(gcFitModel)
##
##
## = 12. growth curve =================================
## ----------------------------------------------------
## --> Try to fit model logistic
## ....... ERROR in nls(). For further information see help(gcFitModel)
## --> Try to fit model richards
## ....... ERROR in nls(). For further information see help(gcFitModel)
## --> Try to fit model gompertz
## ....... ERROR in nls(). For further information see help(gcFitModel)
## --> Try to fit model gompertz.exp
## ... ERROR in nls(). For further information see help(gcFitModel)
## Warning in grofit::gcFitModel(acttime, actwell, gcID, control): gcFitModel:
## Unable to fit this curve parametrically!
##
##
## = 13. growth curve =================================
## ----------------------------------------------------
## --> Try to fit model logistic
## ....... OK
## --> Try to fit model richards
## ....... ERROR in nls(). For further information see help(gcFitModel)
## --> Try to fit model gompertz
## ....... OK
## --> Try to fit model gompertz.exp
## ... ERROR in nls(). For further information see help(gcFitModel)
##
##
## = 14. growth curve =================================
## ----------------------------------------------------
## --> Try to fit model logistic
## ....... OK
## --> Try to fit model richards
## ....... ERROR in nls(). For further information see help(gcFitModel)
## --> Try to fit model gompertz
## ....... OK
## --> Try to fit model gompertz.exp
## ... ERROR in nls(). For further information see help(gcFitModel)
##
##
## = 15. growth curve =================================
## ----------------------------------------------------
## --> Try to fit model logistic
## ....... OK
## --> Try to fit model richards
## ....... OK
## --> Try to fit model gompertz
## ....... OK
## --> Try to fit model gompertz.exp
## ... ERROR in nls(). For further information see help(gcFitModel)
##
##
## = 16. growth curve =================================
## ----------------------------------------------------
## --> Try to fit model logistic
## ....... OK
## --> Try to fit model richards
## ....... ERROR in nls(). For further information see help(gcFitModel)
## --> Try to fit model gompertz
## ....... OK
## --> Try to fit model gompertz.exp
## ... ERROR in nls(). For further information see help(gcFitModel)
##
##
## = 17. growth curve =================================
## ----------------------------------------------------
## --> Try to fit model logistic
## ....... OK
## --> Try to fit model richards
## ....... ERROR in nls(). For further information see help(gcFitModel)
## --> Try to fit model gompertz
## ....... OK
## --> Try to fit model gompertz.exp
## ... ERROR in nls(). For further information see help(gcFitModel)
##
##
## = 18. growth curve =================================
## ----------------------------------------------------
## --> Try to fit model logistic
## ....... OK
## --> Try to fit model richards
## ....... ERROR in nls(). For further information see help(gcFitModel)
## --> Try to fit model gompertz
## ....... OK
## --> Try to fit model gompertz.exp
## ... ERROR in nls(). For further information see help(gcFitModel)
##
##
## = 19. growth curve =================================
## ----------------------------------------------------
## --> Try to fit model logistic
## ....... OK
## --> Try to fit model richards
## ....... ERROR in nls(). For further information see help(gcFitModel)
## --> Try to fit model gompertz
## ....... OK
## --> Try to fit model gompertz.exp
## ... ERROR in nls(). For further information see help(gcFitModel)
##
##
## = 20. growth curve =================================
## ----------------------------------------------------
## --> Try to fit model logistic
## ....... OK
## --> Try to fit model richards
## ....... ERROR in nls(). For further information see help(gcFitModel)
## --> Try to fit model gompertz
## ....... OK
## --> Try to fit model gompertz.exp
## ... ERROR in nls(). For further information see help(gcFitModel)
##
##
## = 21. growth curve =================================
## ----------------------------------------------------
## --> Try to fit model logistic
## ....... OK
## --> Try to fit model richards
## ....... ERROR in nls(). For further information see help(gcFitModel)
## --> Try to fit model gompertz
## ....... OK
## --> Try to fit model gompertz.exp
## ... ERROR in nls(). For further information see help(gcFitModel)
##
##
## = 22. growth curve =================================
## ----------------------------------------------------
## --> Try to fit model logistic
## ....... OK
## --> Try to fit model richards
## ....... ERROR in nls(). For further information see help(gcFitModel)
## --> Try to fit model gompertz
## ....... OK
## --> Try to fit model gompertz.exp
## ... ERROR in nls(). For further information see help(gcFitModel)
##
##
## = 23. growth curve =================================
## ----------------------------------------------------
## --> Try to fit model logistic
## ....... OK
## --> Try to fit model richards
## ....... ERROR in nls(). For further information see help(gcFitModel)
## --> Try to fit model gompertz
## ....... OK
## --> Try to fit model gompertz.exp
## ... ERROR in nls(). For further information see help(gcFitModel)
##
##
## = 24. growth curve =================================
## ----------------------------------------------------
## --> Try to fit model logistic
## ....... OK
## --> Try to fit model richards
## ....... ERROR in nls(). For further information see help(gcFitModel)
## --> Try to fit model gompertz
## ....... OK
## --> Try to fit model gompertz.exp
## ... ERROR in nls(). For further information see help(gcFitModel)
##
##
## = 25. growth curve =================================
## ----------------------------------------------------
## --> Try to fit model logistic
## ....... OK
## --> Try to fit model richards
## ....... ERROR in nls(). For further information see help(gcFitModel)
## --> Try to fit model gompertz
## ....... OK
## --> Try to fit model gompertz.exp
## ... ERROR in nls(). For further information see help(gcFitModel)
##
##
## = 26. growth curve =================================
## ----------------------------------------------------
## --> Try to fit model logistic
## ....... OK
## --> Try to fit model richards
## ....... ERROR in nls(). For further information see help(gcFitModel)
## --> Try to fit model gompertz
## ....... OK
## --> Try to fit model gompertz.exp
## ... ERROR in nls(). For further information see help(gcFitModel)
##
##
## = 27. growth curve =================================
## ----------------------------------------------------
## --> Try to fit model logistic
## ....... OK
## --> Try to fit model richards
## ....... ERROR in nls(). For further information see help(gcFitModel)
## --> Try to fit model gompertz
## ....... OK
## --> Try to fit model gompertz.exp
## ... ERROR in nls(). For further information see help(gcFitModel)
##
##
## = 28. growth curve =================================
## ----------------------------------------------------
## --> Try to fit model logistic
## ....... OK
## --> Try to fit model richards
## ....... ERROR in nls(). For further information see help(gcFitModel)
## --> Try to fit model gompertz
## ....... OK
## --> Try to fit model gompertz.exp
## ... ERROR in nls(). For further information see help(gcFitModel)
##
##
## = 29. growth curve =================================
## ----------------------------------------------------
## --> Try to fit model logistic
## ....... OK
## --> Try to fit model richards
## ....... ERROR in nls(). For further information see help(gcFitModel)
## --> Try to fit model gompertz
## ....... OK
## --> Try to fit model gompertz.exp
## ... ERROR in nls(). For further information see help(gcFitModel)
##
##
## = 30. growth curve =================================
## ----------------------------------------------------
## --> Try to fit model logistic
## ....... OK
## --> Try to fit model richards
## ....... ERROR in nls(). For further information see help(gcFitModel)
## --> Try to fit model gompertz
## ....... OK
## --> Try to fit model gompertz.exp
## ... ERROR in nls(). For further information see help(gcFitModel)
##
##
## = 31. growth curve =================================
## ----------------------------------------------------
## --> Try to fit model logistic
## ....... OK
## --> Try to fit model richards
## ....... ERROR in nls(). For further information see help(gcFitModel)
## --> Try to fit model gompertz
## ....... OK
## --> Try to fit model gompertz.exp
## ... ERROR in nls(). For further information see help(gcFitModel)
##
##
## = 32. growth curve =================================
## ----------------------------------------------------
## --> Try to fit model logistic
## ....... OK
## --> Try to fit model richards
## ....... ERROR in nls(). For further information see help(gcFitModel)
## --> Try to fit model gompertz
## ....... OK
## --> Try to fit model gompertz.exp
## ... ERROR in nls(). For further information see help(gcFitModel)
##
##
## = 33. growth curve =================================
## ----------------------------------------------------
## --> Try to fit model logistic
## ....... OK
## --> Try to fit model richards
## ....... ERROR in nls(). For further information see help(gcFitModel)
## --> Try to fit model gompertz
## ....... OK
## --> Try to fit model gompertz.exp
## ... ERROR in nls(). For further information see help(gcFitModel)
##
##
## = 34. growth curve =================================
## ----------------------------------------------------
## --> Try to fit model logistic
## ....... OK
## --> Try to fit model richards
## ....... ERROR in nls(). For further information see help(gcFitModel)
## --> Try to fit model gompertz
## ....... OK
## --> Try to fit model gompertz.exp
## ... ERROR in nls(). For further information see help(gcFitModel)
##
##
## = 35. growth curve =================================
## ----------------------------------------------------
## --> Try to fit model logistic
## ....... OK
## --> Try to fit model richards
## ....... ERROR in nls(). For further information see help(gcFitModel)
## --> Try to fit model gompertz
## ....... OK
## --> Try to fit model gompertz.exp
## ... ERROR in nls(). For further information see help(gcFitModel)
##
##
## = 36. growth curve =================================
## ----------------------------------------------------
## --> Try to fit model logistic
## ....... OK
## --> Try to fit model richards
## ....... ERROR in nls(). For further information see help(gcFitModel)
## --> Try to fit model gompertz
## ....... OK
## --> Try to fit model gompertz.exp
## ... ERROR in nls(). For further information see help(gcFitModel)
##
##
## = 37. growth curve =================================
## ----------------------------------------------------
## --> Try to fit model logistic
## ....... OK
## --> Try to fit model richards
## ....... ERROR in nls(). For further information see help(gcFitModel)
## --> Try to fit model gompertz
## ....... OK
## --> Try to fit model gompertz.exp
## ... ERROR in nls(). For further information see help(gcFitModel)
##
##
## = 38. growth curve =================================
## ----------------------------------------------------
## --> Try to fit model logistic
## ....... OK
## --> Try to fit model richards
## ....... ERROR in nls(). For further information see help(gcFitModel)
## --> Try to fit model gompertz
## ....... OK
## --> Try to fit model gompertz.exp
## ... ERROR in nls(). For further information see help(gcFitModel)
##
##
## = 39. growth curve =================================
## ----------------------------------------------------
## --> Try to fit model logistic
## ....... OK
## --> Try to fit model richards
## ....... ERROR in nls(). For further information see help(gcFitModel)
## --> Try to fit model gompertz
## ....... OK
## --> Try to fit model gompertz.exp
## ... ERROR in nls(). For further information see help(gcFitModel)
##
##
## = 40. growth curve =================================
## ----------------------------------------------------
## --> Try to fit model logistic
## ....... OK
## --> Try to fit model richards
## ....... ERROR in nls(). For further information see help(gcFitModel)
## --> Try to fit model gompertz
## ....... OK
## --> Try to fit model gompertz.exp
## ... ERROR in nls(). For further information see help(gcFitModel)
##
##
## = 41. growth curve =================================
## ----------------------------------------------------
## --> Try to fit model logistic
## ....... OK
## --> Try to fit model richards
## ....... ERROR in nls(). For further information see help(gcFitModel)
## --> Try to fit model gompertz
## ....... OK
## --> Try to fit model gompertz.exp
## ... ERROR in nls(). For further information see help(gcFitModel)
##
##
## = 42. growth curve =================================
## ----------------------------------------------------
## --> Try to fit model logistic
## ....... OK
## --> Try to fit model richards
## ....... ERROR in nls(). For further information see help(gcFitModel)
## --> Try to fit model gompertz
## ....... OK
## --> Try to fit model gompertz.exp
## ... ERROR in nls(). For further information see help(gcFitModel)
##
##
## = 43. growth curve =================================
## ----------------------------------------------------
## --> Try to fit model logistic
## ....... OK
## --> Try to fit model richards
## ....... ERROR in nls(). For further information see help(gcFitModel)
## --> Try to fit model gompertz
## ....... OK
## --> Try to fit model gompertz.exp
## ... ERROR in nls(). For further information see help(gcFitModel)
##
##
## = 44. growth curve =================================
## ----------------------------------------------------
## --> Try to fit model logistic
## ....... OK
## --> Try to fit model richards
## ....... ERROR in nls(). For further information see help(gcFitModel)
## --> Try to fit model gompertz
## ....... OK
## --> Try to fit model gompertz.exp
## ... ERROR in nls(). For further information see help(gcFitModel)
##
##
## = 45. growth curve =================================
## ----------------------------------------------------
## --> Try to fit model logistic
## ....... OK
## --> Try to fit model richards
## ....... ERROR in nls(). For further information see help(gcFitModel)
## --> Try to fit model gompertz
## ....... OK
## --> Try to fit model gompertz.exp
## ... ERROR in nls(). For further information see help(gcFitModel)
##
##
## = 46. growth curve =================================
## ----------------------------------------------------
## --> Try to fit model logistic
## ....... OK
## --> Try to fit model richards
## ....... ERROR in nls(). For further information see help(gcFitModel)
## --> Try to fit model gompertz
## ....... OK
## --> Try to fit model gompertz.exp
## ... ERROR in nls(). For further information see help(gcFitModel)
##
##
## = 47. growth curve =================================
## ----------------------------------------------------
## --> Try to fit model logistic
## ....... OK
## --> Try to fit model richards
## ....... ERROR in nls(). For further information see help(gcFitModel)
## --> Try to fit model gompertz
## ....... OK
## --> Try to fit model gompertz.exp
## ... ERROR in nls(). For further information see help(gcFitModel)
##
##
## = 48. growth curve =================================
## ----------------------------------------------------
## --> Try to fit model logistic
## ....... OK
## --> Try to fit model richards
## ....... ERROR in nls(). For further information see help(gcFitModel)
## --> Try to fit model gompertz
## ....... OK
## --> Try to fit model gompertz.exp
## ... ERROR in nls(). For further information see help(gcFitModel)
##
##
## = 49. growth curve =================================
## ----------------------------------------------------
## --> Try to fit model logistic
## ....... OK
## --> Try to fit model richards
## ....... ERROR in nls(). For further information see help(gcFitModel)
## --> Try to fit model gompertz
## ....... OK
## --> Try to fit model gompertz.exp
## ... ERROR in nls(). For further information see help(gcFitModel)
##
##
## = 50. growth curve =================================
## ----------------------------------------------------
## --> Try to fit model logistic
## ....... OK
## --> Try to fit model richards
## ....... ERROR in nls(). For further information see help(gcFitModel)
## --> Try to fit model gompertz
## ....... OK
## --> Try to fit model gompertz.exp
## ... ERROR in nls(). For further information see help(gcFitModel)
##
##
## = 51. growth curve =================================
## ----------------------------------------------------
## --> Try to fit model logistic
## ....... OK
## --> Try to fit model richards
## ....... ERROR in nls(). For further information see help(gcFitModel)
## --> Try to fit model gompertz
## ....... OK
## --> Try to fit model gompertz.exp
## ... ERROR in nls(). For further information see help(gcFitModel)
##
##
## = 52. growth curve =================================
## ----------------------------------------------------
## --> Try to fit model logistic
## ....... OK
## --> Try to fit model richards
## ....... ERROR in nls(). For further information see help(gcFitModel)
## --> Try to fit model gompertz
## ....... OK
## --> Try to fit model gompertz.exp
## ... ERROR in nls(). For further information see help(gcFitModel)
##
##
## = 53. growth curve =================================
## ----------------------------------------------------
## --> Try to fit model logistic
## ....... OK
## --> Try to fit model richards
## ....... ERROR in nls(). For further information see help(gcFitModel)
## --> Try to fit model gompertz
## ....... OK
## --> Try to fit model gompertz.exp
## ... ERROR in nls(). For further information see help(gcFitModel)
##
##
## = 54. growth curve =================================
## ----------------------------------------------------
## --> Try to fit model logistic
## ....... OK
## --> Try to fit model richards
## ....... ERROR in nls(). For further information see help(gcFitModel)
## --> Try to fit model gompertz
## ....... OK
## --> Try to fit model gompertz.exp
## ... ERROR in nls(). For further information see help(gcFitModel)
##
##
## = 55. growth curve =================================
## ----------------------------------------------------
## --> Try to fit model logistic
## ....... OK
## --> Try to fit model richards
## ....... ERROR in nls(). For further information see help(gcFitModel)
## --> Try to fit model gompertz
## ....... OK
## --> Try to fit model gompertz.exp
## ... ERROR in nls(). For further information see help(gcFitModel)
##
##
## = 56. growth curve =================================
## ----------------------------------------------------
## --> Try to fit model logistic
## ....... OK
## --> Try to fit model richards
## ....... ERROR in nls(). For further information see help(gcFitModel)
## --> Try to fit model gompertz
## ....... OK
## --> Try to fit model gompertz.exp
## ... ERROR in nls(). For further information see help(gcFitModel)
##
##
## = 57. growth curve =================================
## ----------------------------------------------------
## --> Try to fit model logistic
## ....... OK
## --> Try to fit model richards
## ....... ERROR in nls(). For further information see help(gcFitModel)
## --> Try to fit model gompertz
## ....... OK
## --> Try to fit model gompertz.exp
## ... ERROR in nls(). For further information see help(gcFitModel)
##
##
## = 58. growth curve =================================
## ----------------------------------------------------
## --> Try to fit model logistic
## ....... OK
## --> Try to fit model richards
## ....... ERROR in nls(). For further information see help(gcFitModel)
## --> Try to fit model gompertz
## ....... OK
## --> Try to fit model gompertz.exp
## ... ERROR in nls(). For further information see help(gcFitModel)
##
##
## = 59. growth curve =================================
## ----------------------------------------------------
## --> Try to fit model logistic
## ....... OK
## --> Try to fit model richards
## ....... ERROR in nls(). For further information see help(gcFitModel)
## --> Try to fit model gompertz
## ....... OK
## --> Try to fit model gompertz.exp
## ... ERROR in nls(). For further information see help(gcFitModel)
##
##
## = 60. growth curve =================================
## ----------------------------------------------------
## --> Try to fit model logistic
## ....... OK
## --> Try to fit model richards
## ....... ERROR in nls(). For further information see help(gcFitModel)
## --> Try to fit model gompertz
## ....... OK
## --> Try to fit model gompertz.exp
## ... ERROR in nls(). For further information see help(gcFitModel)
##
##
## = 61. growth curve =================================
## ----------------------------------------------------
## --> Try to fit model logistic
## ....... OK
## --> Try to fit model richards
## ....... ERROR in nls(). For further information see help(gcFitModel)
## --> Try to fit model gompertz
## ....... OK
## --> Try to fit model gompertz.exp
## ... ERROR in nls(). For further information see help(gcFitModel)
##
##
## = 62. growth curve =================================
## ----------------------------------------------------
## --> Try to fit model logistic
## ....... OK
## --> Try to fit model richards
## ....... ERROR in nls(). For further information see help(gcFitModel)
## --> Try to fit model gompertz
## ....... OK
## --> Try to fit model gompertz.exp
## ... ERROR in nls(). For further information see help(gcFitModel)
##
##
## = 63. growth curve =================================
## ----------------------------------------------------
## --> Try to fit model logistic
## ....... OK
## --> Try to fit model richards
## ....... ERROR in nls(). For further information see help(gcFitModel)
## --> Try to fit model gompertz
## ....... OK
## --> Try to fit model gompertz.exp
## ... ERROR in nls(). For further information see help(gcFitModel)
##
##
## = 64. growth curve =================================
## ----------------------------------------------------
## --> Try to fit model logistic
## ....... OK
## --> Try to fit model richards
## ....... ERROR in nls(). For further information see help(gcFitModel)
## --> Try to fit model gompertz
## ....... OK
## --> Try to fit model gompertz.exp
## ... ERROR in nls(). For further information see help(gcFitModel)
##
##
## = 65. growth curve =================================
## ----------------------------------------------------
## --> Try to fit model logistic
## ....... OK
## --> Try to fit model richards
## ....... ERROR in nls(). For further information see help(gcFitModel)
## --> Try to fit model gompertz
## ....... OK
## --> Try to fit model gompertz.exp
## ... ERROR in nls(). For further information see help(gcFitModel)
##
##
## = 66. growth curve =================================
## ----------------------------------------------------
## --> Try to fit model logistic
## ....... OK
## --> Try to fit model richards
## ....... ERROR in nls(). For further information see help(gcFitModel)
## --> Try to fit model gompertz
## ....... OK
## --> Try to fit model gompertz.exp
## ... ERROR in nls(). For further information see help(gcFitModel)
##
##
## = 67. growth curve =================================
## ----------------------------------------------------
## --> Try to fit model logistic
## ....... OK
## --> Try to fit model richards
## ....... ERROR in nls(). For further information see help(gcFitModel)
## --> Try to fit model gompertz
## ....... OK
## --> Try to fit model gompertz.exp
## ... ERROR in nls(). For further information see help(gcFitModel)
##
##
## = 68. growth curve =================================
## ----------------------------------------------------
## --> Try to fit model logistic
## ....... OK
## --> Try to fit model richards
## ....... ERROR in nls(). For further information see help(gcFitModel)
## --> Try to fit model gompertz
## ....... OK
## --> Try to fit model gompertz.exp
## ... ERROR in nls(). For further information see help(gcFitModel)
##
##
## = 69. growth curve =================================
## ----------------------------------------------------
## --> Try to fit model logistic
## ....... OK
## --> Try to fit model richards
## ....... ERROR in nls(). For further information see help(gcFitModel)
## --> Try to fit model gompertz
## ....... OK
## --> Try to fit model gompertz.exp
## ... ERROR in nls(). For further information see help(gcFitModel)
##
##
## = 70. growth curve =================================
## ----------------------------------------------------
## --> Try to fit model logistic
## ....... OK
## --> Try to fit model richards
## ....... ERROR in nls(). For further information see help(gcFitModel)
## --> Try to fit model gompertz
## ....... OK
## --> Try to fit model gompertz.exp
## ... ERROR in nls(). For further information see help(gcFitModel)
##
##
## = 71. growth curve =================================
## ----------------------------------------------------
## --> Try to fit model logistic
## ....... ERROR in nls(). For further information see help(gcFitModel)
## --> Try to fit model richards
## ....... ERROR in nls(). For further information see help(gcFitModel)
## --> Try to fit model gompertz
## ....... ERROR in nls(). For further information see help(gcFitModel)
## --> Try to fit model gompertz.exp
## ... ERROR in nls(). For further information see help(gcFitModel)
## Warning in grofit::gcFitModel(acttime, actwell, gcID, control): gcFitModel:
## Unable to fit this curve parametrically!
##
##
## = 72. growth curve =================================
## ----------------------------------------------------
## --> Try to fit model logistic
## ....... OK
## --> Try to fit model richards
## ....... ERROR in nls(). For further information see help(gcFitModel)
## --> Try to fit model gompertz
## ....... OK
## --> Try to fit model gompertz.exp
## ... ERROR in nls(). For further information see help(gcFitModel)
##
##
## = 73. growth curve =================================
## ----------------------------------------------------
## --> Try to fit model logistic
## ....... OK
## --> Try to fit model richards
## ....... ERROR in nls(). For further information see help(gcFitModel)
## --> Try to fit model gompertz
## ....... OK
## --> Try to fit model gompertz.exp
## ... ERROR in nls(). For further information see help(gcFitModel)
##
##
## = 74. growth curve =================================
## ----------------------------------------------------
## --> Try to fit model logistic
## ....... OK
## --> Try to fit model richards
## ....... ERROR in nls(). For further information see help(gcFitModel)
## --> Try to fit model gompertz
## ....... OK
## --> Try to fit model gompertz.exp
## ... ERROR in nls(). For further information see help(gcFitModel)
##
##
## = 75. growth curve =================================
## ----------------------------------------------------
## --> Try to fit model logistic
## ....... OK
## --> Try to fit model richards
## ....... ERROR in nls(). For further information see help(gcFitModel)
## --> Try to fit model gompertz
## ....... OK
## --> Try to fit model gompertz.exp
## ... ERROR in nls(). For further information see help(gcFitModel)
##
##
## = 76. growth curve =================================
## ----------------------------------------------------
## --> Try to fit model logistic
## ....... OK
## --> Try to fit model richards
## ....... ERROR in nls(). For further information see help(gcFitModel)
## --> Try to fit model gompertz
## ....... OK
## --> Try to fit model gompertz.exp
## ... ERROR in nls(). For further information see help(gcFitModel)
##
##
## = 77. growth curve =================================
## ----------------------------------------------------
## --> Try to fit model logistic
## ....... OK
## --> Try to fit model richards
## ....... ERROR in nls(). For further information see help(gcFitModel)
## --> Try to fit model gompertz
## ....... OK
## --> Try to fit model gompertz.exp
## ... ERROR in nls(). For further information see help(gcFitModel)
dev.off()
## png
##   2


 https://github.com/raim/platexpress

 \(\Leftarrow \) © Kai, today